
Water quality in the Long Island Sound plateaued or worsened, the environmental group Save the Sound reported Thursday.
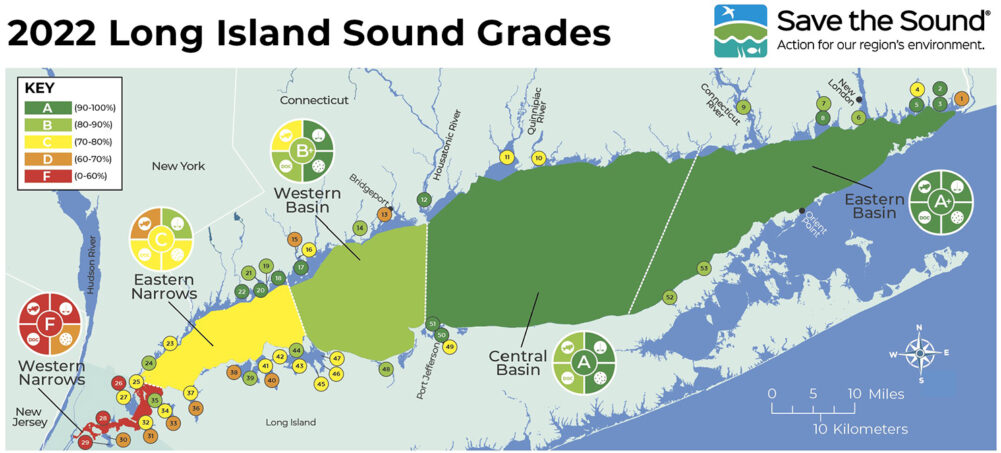
The waters in the Western Basin, which includes the Suffolk and Nassau shorelines, and Eastern Narrows, the New York City shoreline, are in worse shape than the waters off the eastern portions of Long Island.
“After previous years of improvement, the 2022 report raised concerns for the future, finding that trends towards improving open water quality have stalled in several portions of the Sound and poor grades in bays have persisted. Equally concerning, the report’s science advisors noted that previous gains in water quality may be threatened by rising water temperature in Long Island Sound. There were hopeful signs, as well, indicating that efforts to reduce nitrogen pollution are having a positive impact in the western Sound, demonstrated by modest improvement in open waters of New York City,” the organization said.
Overall, efforts in conservation and improved wastewater treatment have helped clean the Sound. the group said. The waters of eastern Long Island Sound continue to receive excellent grades, because of strong tidal exchange with the Atlantic Ocean and lower population density, compared to areas farther west. The Eastern Basin and Central Basin of the Sound received A+ and A grades.
Bu lLetter grades for the Western Basin and Eastern Narrows have stalled at B+ and C grades, respectively.
Experts warned of the potential for backsliding on water quality. The Western Basin and Eastern Narrows stretch from Bridgeport on the Connecticut shoreline and Port Jefferson on the Long Island shoreline, west to New York City.
Of the 53 bay segments monitored, more than half (57%) received weaker grades of C, D, or F. Only 11 bay segments earned an A. Bays are highly susceptible to pollutants from their neighboring communities, the group said, noting that while local efforts underway have produced some improvements, the low overall grades show the impact that pollution has on coastal waters. This is especially true, STS said, where tidal exchange with the open Sound is low and pollutant loads from rivers and streams feeding into bays are high.
The report reaffirmed prior evidence that the quality of nearby open water in the Sound does not always predict the quality of water in adjacent bays. Even bays located near the most pristine sections of open water can still score poorly, due to localized pollution and other factors.
David Ansel, regional director of water protection for Save the Sound, commented, “We’re finding evidence that investment in clean water infrastructure leads to measurable benefits for Long Island Sound. It’s also clear that there is much more to be done, particularly in stressed bays throughout the length of the Sound, as well as in the western Sound.”
Science advisors for the report card, Jamie Vaudrey, PhD, and Jason Krumholz, PhD, also noted that the impacts of climate change could reverse recent improvements. They cited a 2021 peer-reviewed study from Drs. Michael Whitney and Penny Vlahos of the University of Connecticut noting that water temperature in the western Long Island Sound is increasing by as much as 0.8 degrees Celsius (nearly 1.4 degrees Fahrenheit) per decade. Rising water temperature has a range of damaging impacts on the marine environmentincluding. Among its impacts, rising temperatures elevate the risk for hypoxia – low levels of oxygen in the water. As the 2022 Long Island Sound Report Card states, “the warmer the water, the less oxygen it is able to hold…Many longtime residents of the region remember the severe hypoxic conditions that plagued the Sound back in the 1970s and 1980s, when fish kills were commonplace between Bridgeport, Conn., and New York City.”
Results from the 2022 Long Island Sound Report Card areavaiable at www.SoundHealthExplorer.com. The site includes an interactive map allowing visitors to click on open water basins and specific bays to view water quality grades and the data behind them.